Favorite Data Visualizations in Real Estate - Week of November 27
Peaking housing inventory, rental pricing trends, beautiful map.
This week we discover peaking housing inventory, along with rental pricing trends:
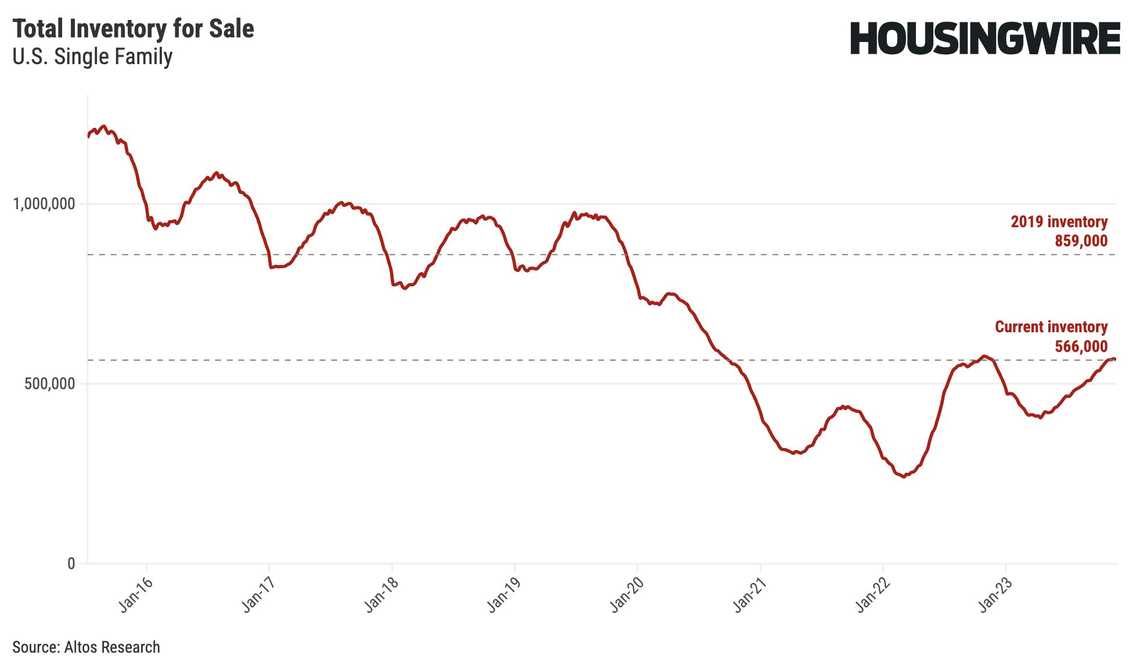
Mike Simonsen artfully shares new data on national housing sales in the United States:
Inventory has (finally!) peaked for the year, down by 0.7% from last week. At 566,000 there’s 0.5% more homes on the market now than last year at this time.
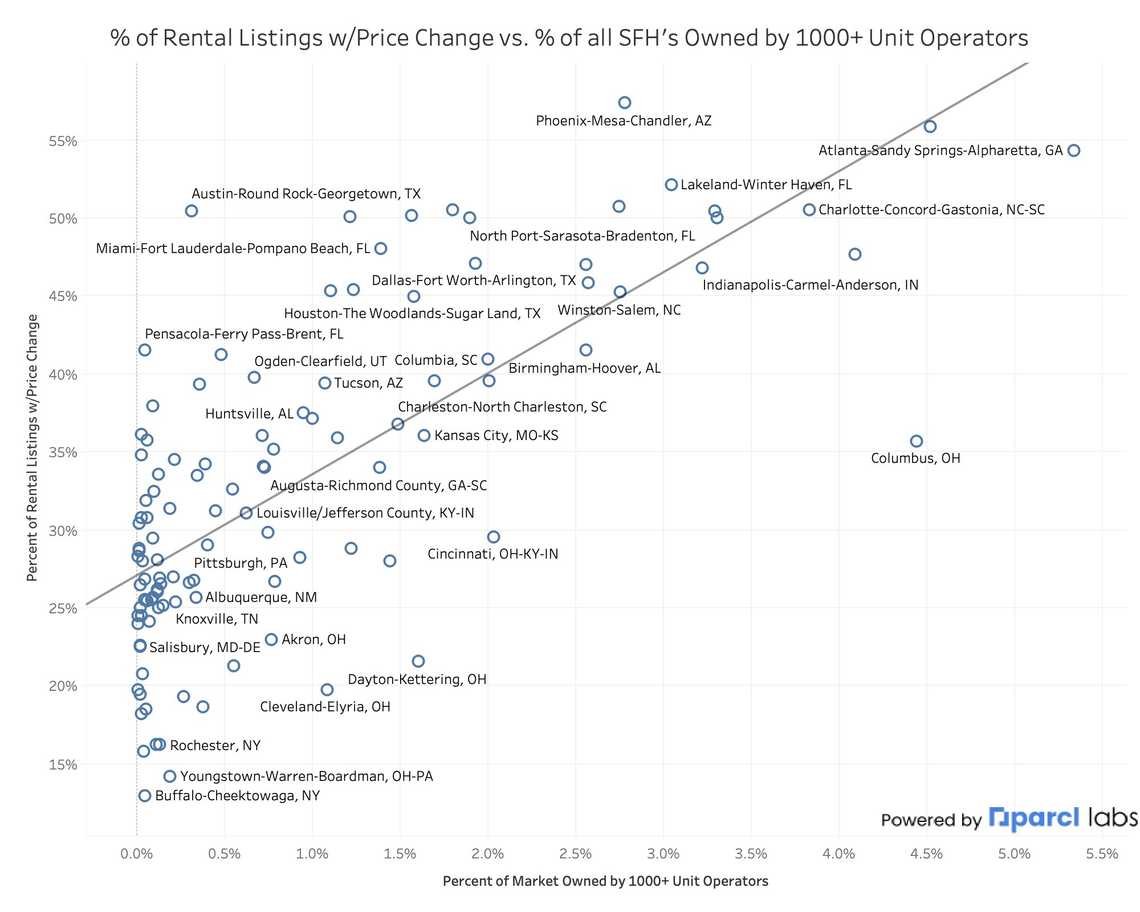
Metro city areas with high concentrationsof corporate home buyers are proving to be much more efficient markets - with rental prices quickly changing as market conditions change. This means buyers and renters need to know their neighbors to better predict future prices. Great story from Jason Lewis and Parcll Labs.
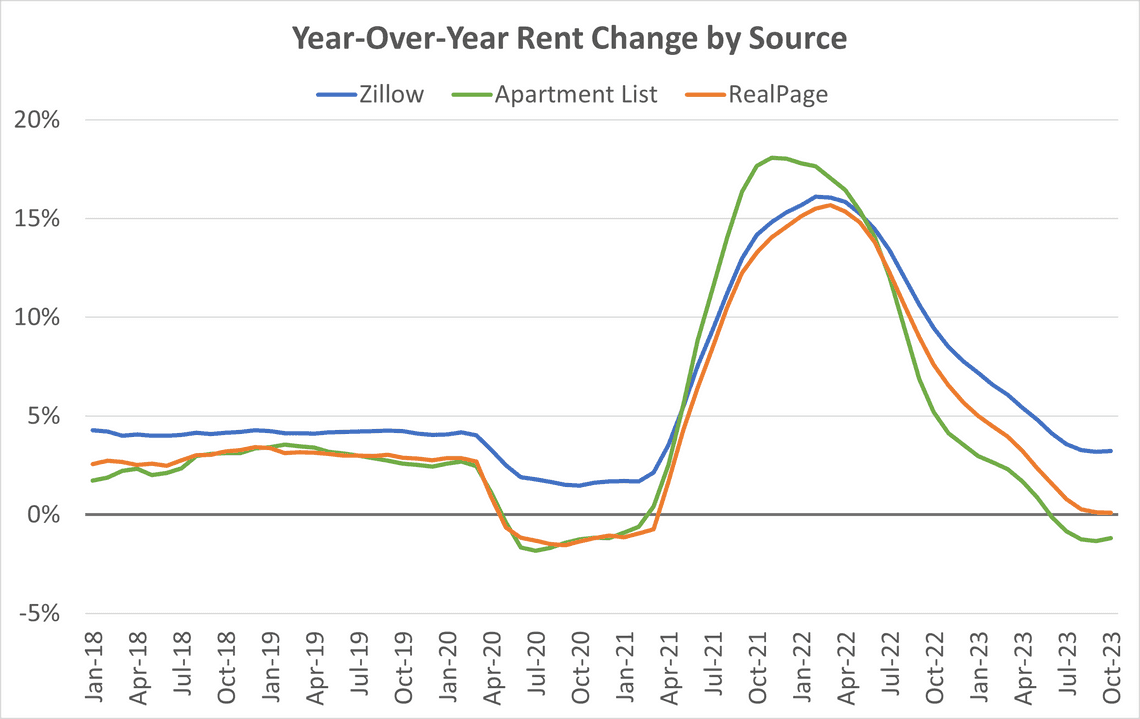
Jay Parsons compares rental site data to illustrate how rents are now contracting across the country. Good news for renters looking to make a move.
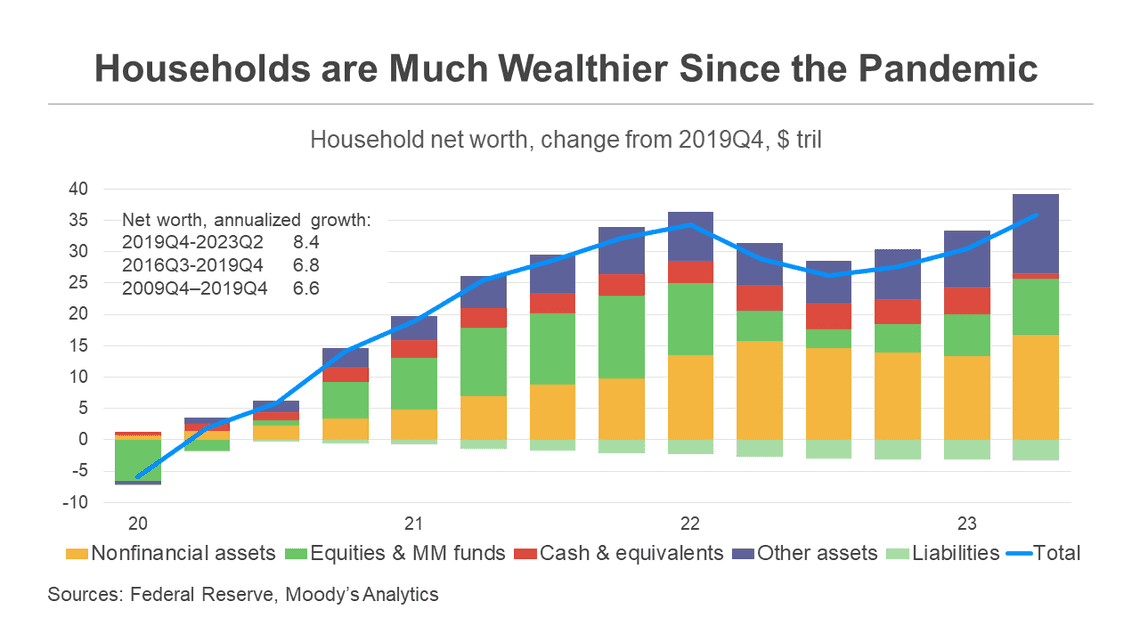
Mark Zandi lays out the data on why and how American consumers are staying strong despite challenging economic conditions. Their net worth is still higher than before the pandemic.
The creative Milos created a new map of Iberia using elevation and river data. The color of each river shows which basin it flows into and the width of each river reflects its size.
- Stew


