Favorite Data Visualizations for the Week in Real Estate Feb 14
New insights into housing inventory, personal spending, foreclosure data.
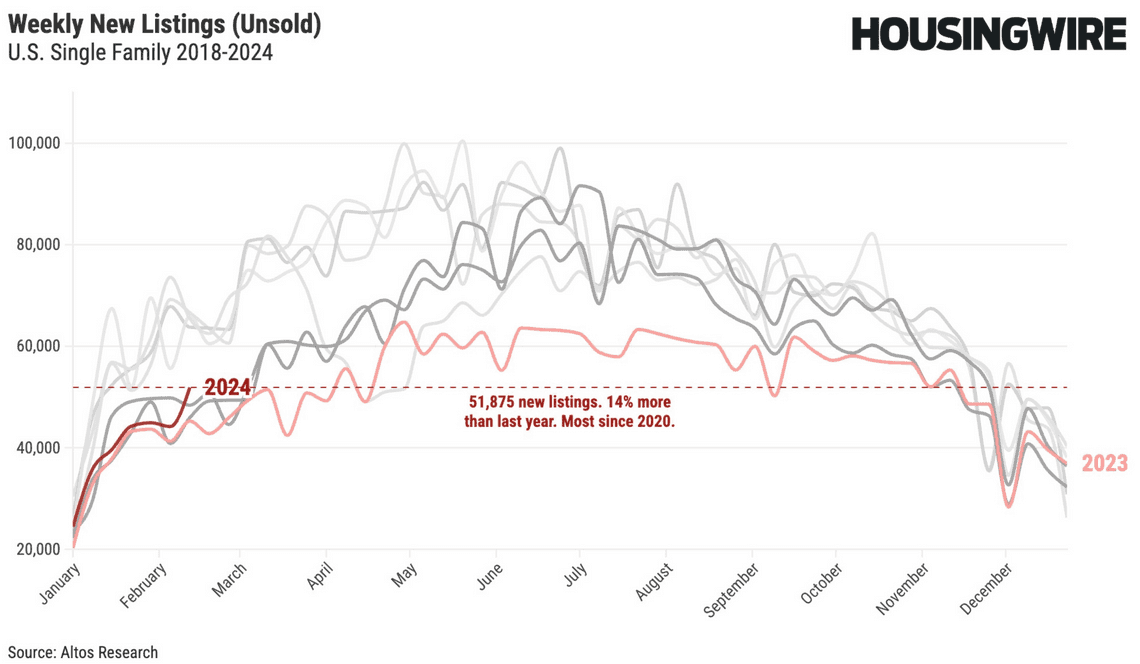
The Data first analysis from Mike Simonsen is spot on again this week: He highlights: New listings this week climbed 14% vs. last year at this time. While available inventory ticked down from last week, total inventory is 12% greater than last year.
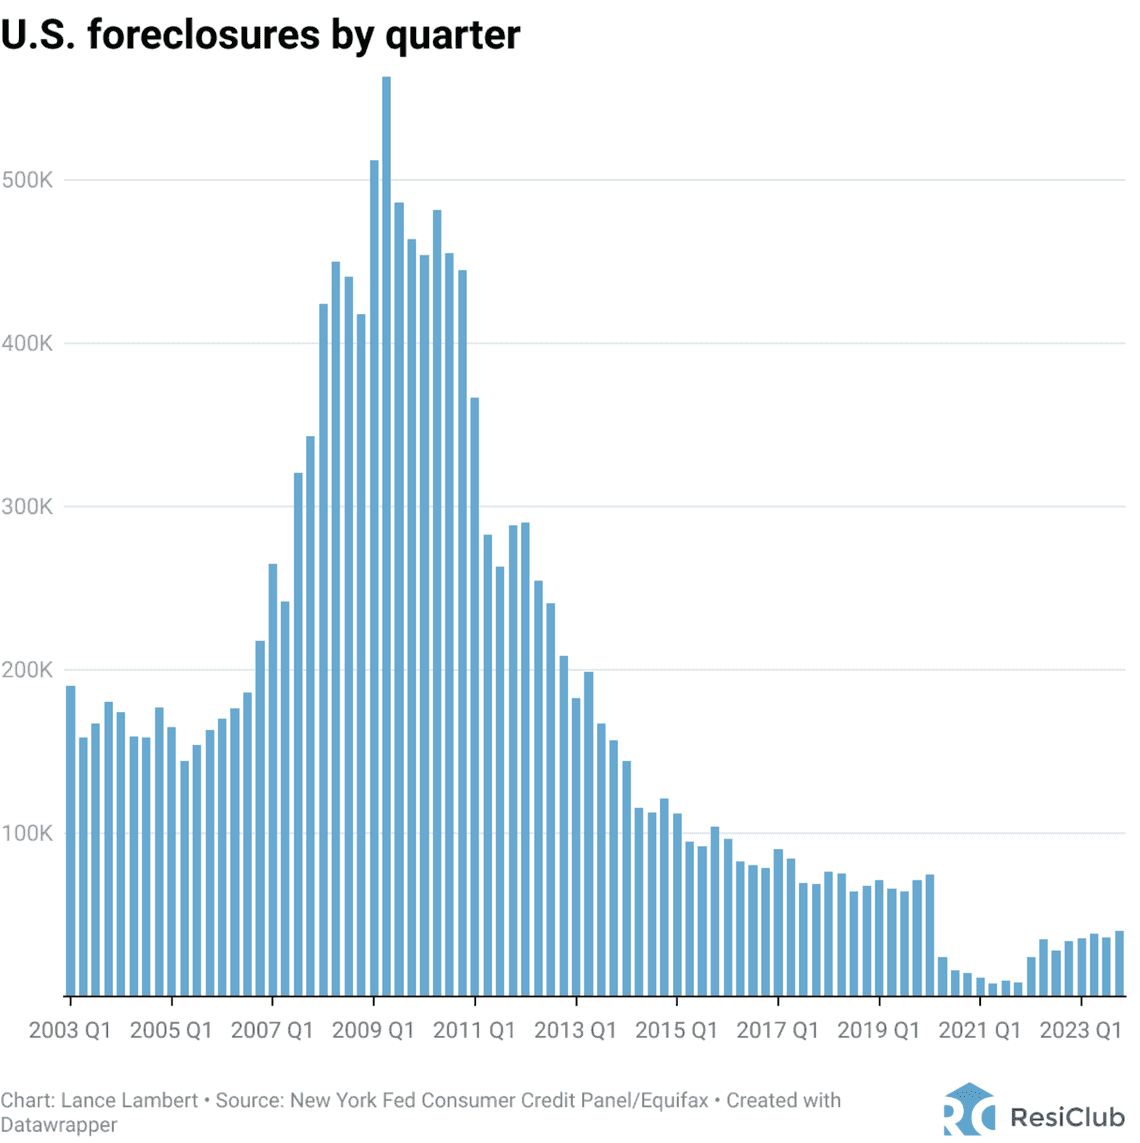
Lance Lambert puts the overall foreclosure numbers in perspective - showing how we are still near historical lows with little risk for crisis in 2024.
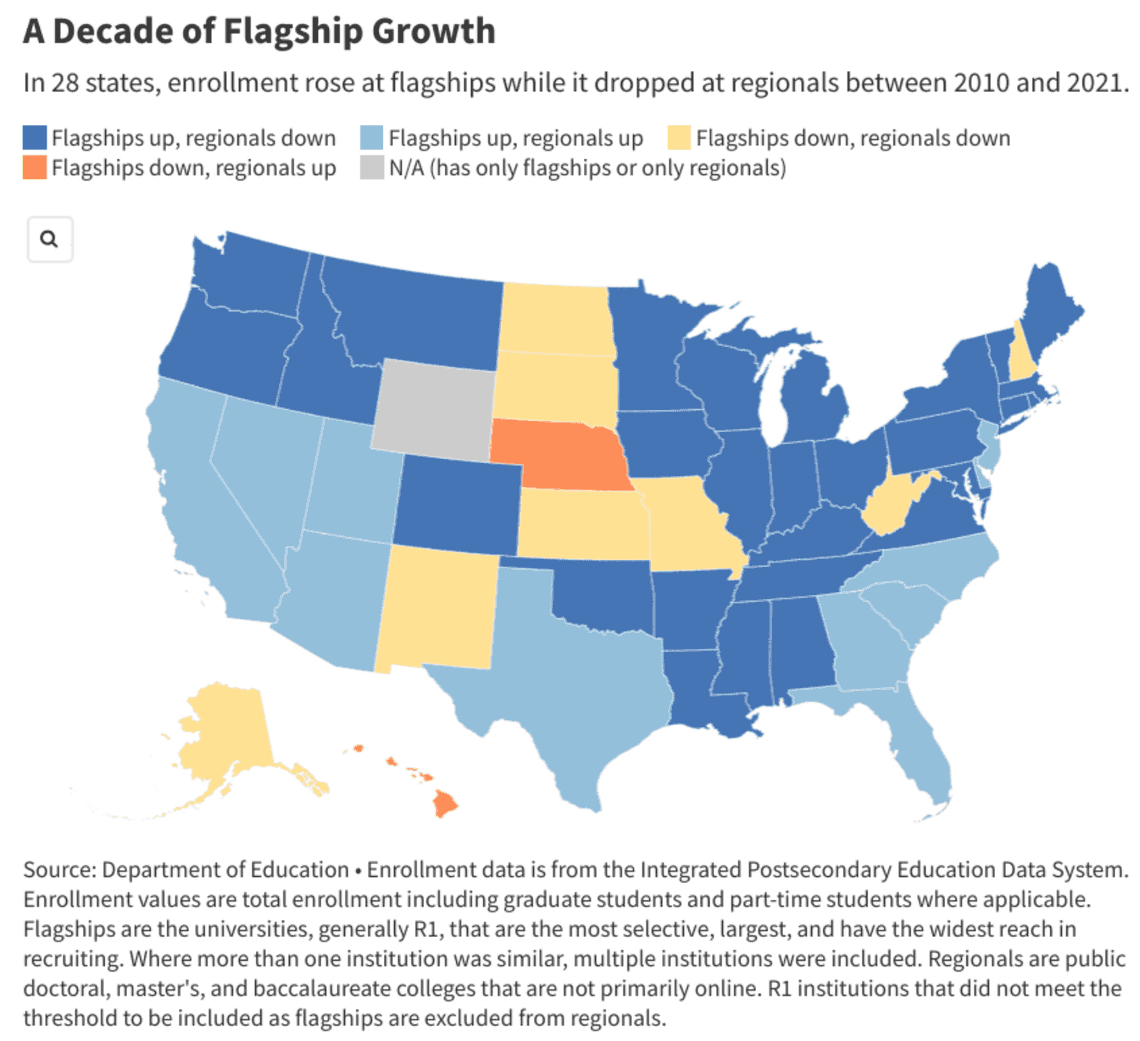
Colleges show where people want to live. Jim Russell posts this map that clearly shows how States college enrollment growth highly overlaps with migration data - people keep moving to The South!
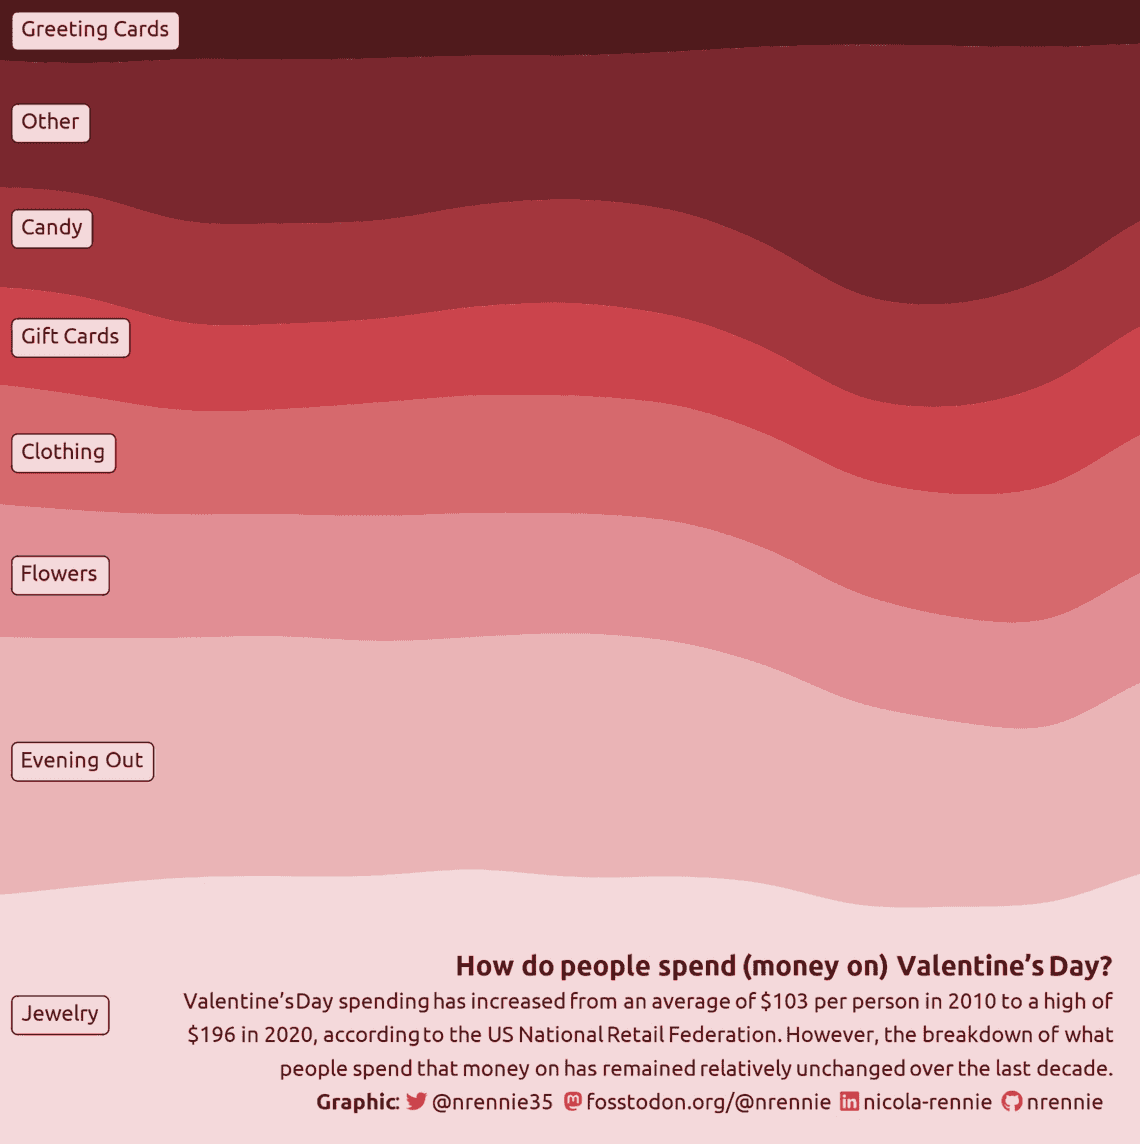
How do people spend their money on Valentine's Day - a wonderful visualization from the brilliant Nicola Rennie.
- Stew


